RICE Prioritization Calculator
Stop arguing over the roadmap. Score each feature on Reach, Impact, Confidence and Effort, and this free calculator ranks them instantly by a defensible RICE number. Everything runs in your browser — no sign-up required.
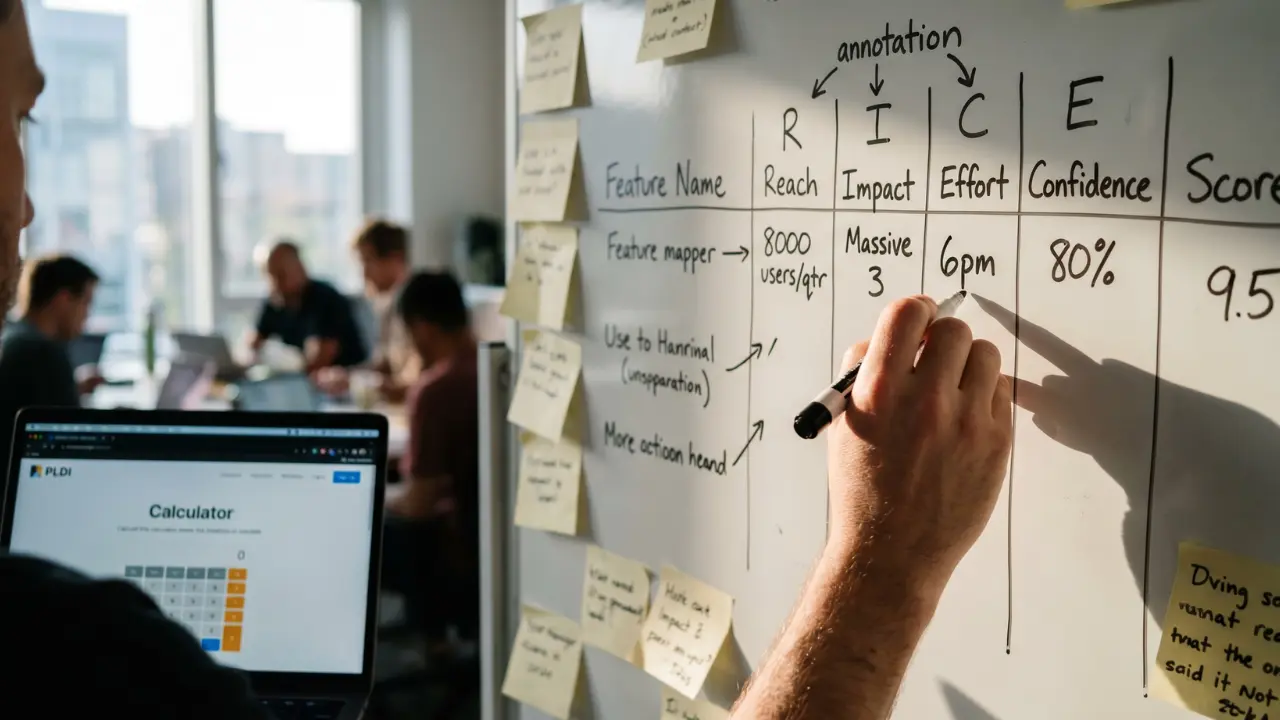
RICE prioritization scores product features and initiatives on four factors — Reach, Impact, Confidence and Effort — to turn roadmap debates into a single comparable number. The item with the highest score delivers the most expected value for the least work.
Score your features
| Feature / Initiative | Reach people / period | Impact 3 to 0.25 | Confidence % | Effort person-months | RICE | Rank |
|---|
Your data stays in your browser (local storage only). Nothing is uploaded.
How to use this RICE calculator
- List your candidates. Add one row per feature, bet or initiative you're weighing for the same roadmap window.
- Enter Reach. How many people or events it affects in a fixed period (keep the period identical for every row).
- Pick Impact. Use the preset scale — massive (3) down to minimal (0.25).
- Set Confidence. How sure are your estimates? 100% high, 80% medium, 50% low.
- Estimate Effort. Total person-months across product, design and engineering.
- Read the rank. The calculator scores and ranks every row live, and highlights your top priority.
The four factors, defined
Reach — the number of people or events affected in a set time period (e.g. users per quarter). Use real product analytics where possible rather than guesses.
Impact — how much the initiative moves your goal per person, on the standard five-point scale: 3 = massive, 2 = high, 1 = medium, 0.5 = low, 0.25 = minimal.
Confidence — a percentage that discounts shaky estimates. 100% means data-backed, 80% means some evidence, 50% means largely intuition.
Effort — total work in person-months across the whole team. It's the denominator, so big projects must return proportionally more value to win.
Effort sits in the denominator, which means RICE quietly rewards small, high-confidence bets over big, exciting ones. Two features with identical Reach and Impact will rank very differently if one takes 1 person-month and the other takes 6. Use this to expose "obvious" big projects that quietly destroy throughput.
Lock your time window before you start. If one row's Reach is "users per quarter" and another's is "users per month", the scores are not comparable and your ranking is meaningless. Pick one period for the whole list.
RICE is an input to a prioritization conversation, not a verdict. It can't see dependencies, compliance mandates or strategic bets whose value you can't yet estimate. Never let a spreadsheet auto-approve a roadmap your judgment disagrees with.
Looking for more tools? Browse all product management calculators.
Frequently asked questions
What is the RICE prioritization framework?
RICE is a scoring model that ranks product features and initiatives by four factors: Reach, Impact, Confidence and Effort. It replaces gut-feel debates with a single comparable number, helping product teams decide what to build next based on expected value per unit of work.
What is the RICE score formula?
The RICE score equals Reach multiplied by Impact multiplied by Confidence, all divided by Effort. Confidence is applied as a percentage. A higher score means more expected value for less work, so the highest-scoring items rise to the top of your roadmap.
How is Reach measured in RICE?
Reach is the number of people or events affected within a set time period, such as users per quarter or transactions per month. Use real product data where you can. Keep the time window identical across every item so scores stay comparable.
What are the standard RICE Impact values?
Impact uses a fixed five-point scale: 3 for massive, 2 for high, 1 for medium, 0.5 for low and 0.25 for minimal. Using preset values rather than free numbers keeps scoring consistent between teammates and across different initiatives.
How do I choose a Confidence percentage?
Confidence reflects how sure you are of your Reach and Impact estimates. Use 100% for high confidence backed by data, 80% for medium with some evidence, and 50% for low or mostly intuition. Confidence guards against overscoring speculative bets.
How is Effort measured in RICE?
Effort is the total work required from product, design and engineering, usually expressed in person-months. Estimate the whole team's combined time, not just engineering. Because Effort is the denominator, larger projects must deliver proportionally more value to rank highly.
What is a good RICE score?
There is no universal threshold; RICE scores are only meaningful relative to each other. A score of 200 means nothing alone but ranks above one of 80. Use the numbers to compare items in the same list, not as an absolute pass mark.
What is the difference between RICE and ICE?
ICE scores Impact, Confidence and Ease, while RICE adds Reach and swaps Ease for Effort. RICE is more rigorous for roadmap decisions because it weights how many users are affected and divides by real work, making it harder to game.
Does this RICE calculator save my data?
Your entries are stored only in your own browser using local storage, so they survive a page refresh and never leave your device. Nothing is uploaded to a server and no sign-up is required. Use the Reset button to clear everything.
When should I not use RICE?
Avoid RICE for must-do compliance work, urgent incidents or strategic bets where value cannot be estimated. It also struggles with dependencies between items. Treat RICE as a structured input to prioritization discussions, not an automatic decision that overrides product judgment.