The Opportunity Solution Tree, Without the Fluff
- Prioritize outcomes over outputs: Anchor your entire discovery process to a single, measurable business metric before writing any code.
- Frame problems, not features: Treat opportunities as unresolved customer needs rather than immediate software solutions.
- Compare solutions side-by-side: Never evaluate a single feature idea in a vacuum; always test multiple solutions against the same opportunity.
- Run rapid experiments: Use the lowest fidelity tests possible to validate or invalidate the assumptions behind each solution branch.
- Maintain dynamic updates: Treat the tree as a living document that shifts weekly based on fresh customer interview data.
Far too many product teams treat continuous discovery as a chaotic brainstorming exercise. They collect scattered customer interview notes, brainstorm a dozen random features, and blindly toss them into the backlog.
This disjointed approach completely breaks your system for lean product validation. It creates bloated roadmaps based on gut feelings rather than empirical market data.
To restore order and protect your engineering budget, you need a visual framework that ruthlessly connects daily experiments to concrete business goals.
By adopting this structural model, your product trio will stop debating subjective feature preferences and start shipping measurable value.
The Trap of Output-Driven Roadmaps
Most B2B SaaS roadmaps are simply lists of disconnected outputs. They promise specific feature deliverables by specific quarterly deadlines.
This model falsely assumes that shipping software equates to delivering business value. In reality, deploying a massive feature set that fails to move your core metrics is a strategic failure.
To scale effectively, product organizations must adopt an outcome over output mentality. You must decouple the destination (the business metric) from the specific path you take to get there (the feature).
Shifting to an Outcome Over Output Mindset
When you fixate on outcomes, your team gains the autonomy to pivot when an idea fails in the market. This flexibility is the core benefit of the opportunity mapping framework popularized by Teresa Torres.
It visualizes exactly how your proposed solutions ladder up to the overarching business goal. If a solution fails to drive the outcome, you can easily trace the branches back up the map and pivot to a different approach without losing strategic momentum.
Anatomy of an Opportunity Solution Tree
A highly effective tree relies on a strict, four-tier hierarchy. Skipping a tier or blurring the lines between them guarantees an unfocused product strategy.
The Root: Defining the Clear Outcome
The absolute top of your tree is the single metric your product trio is accountable for improving.
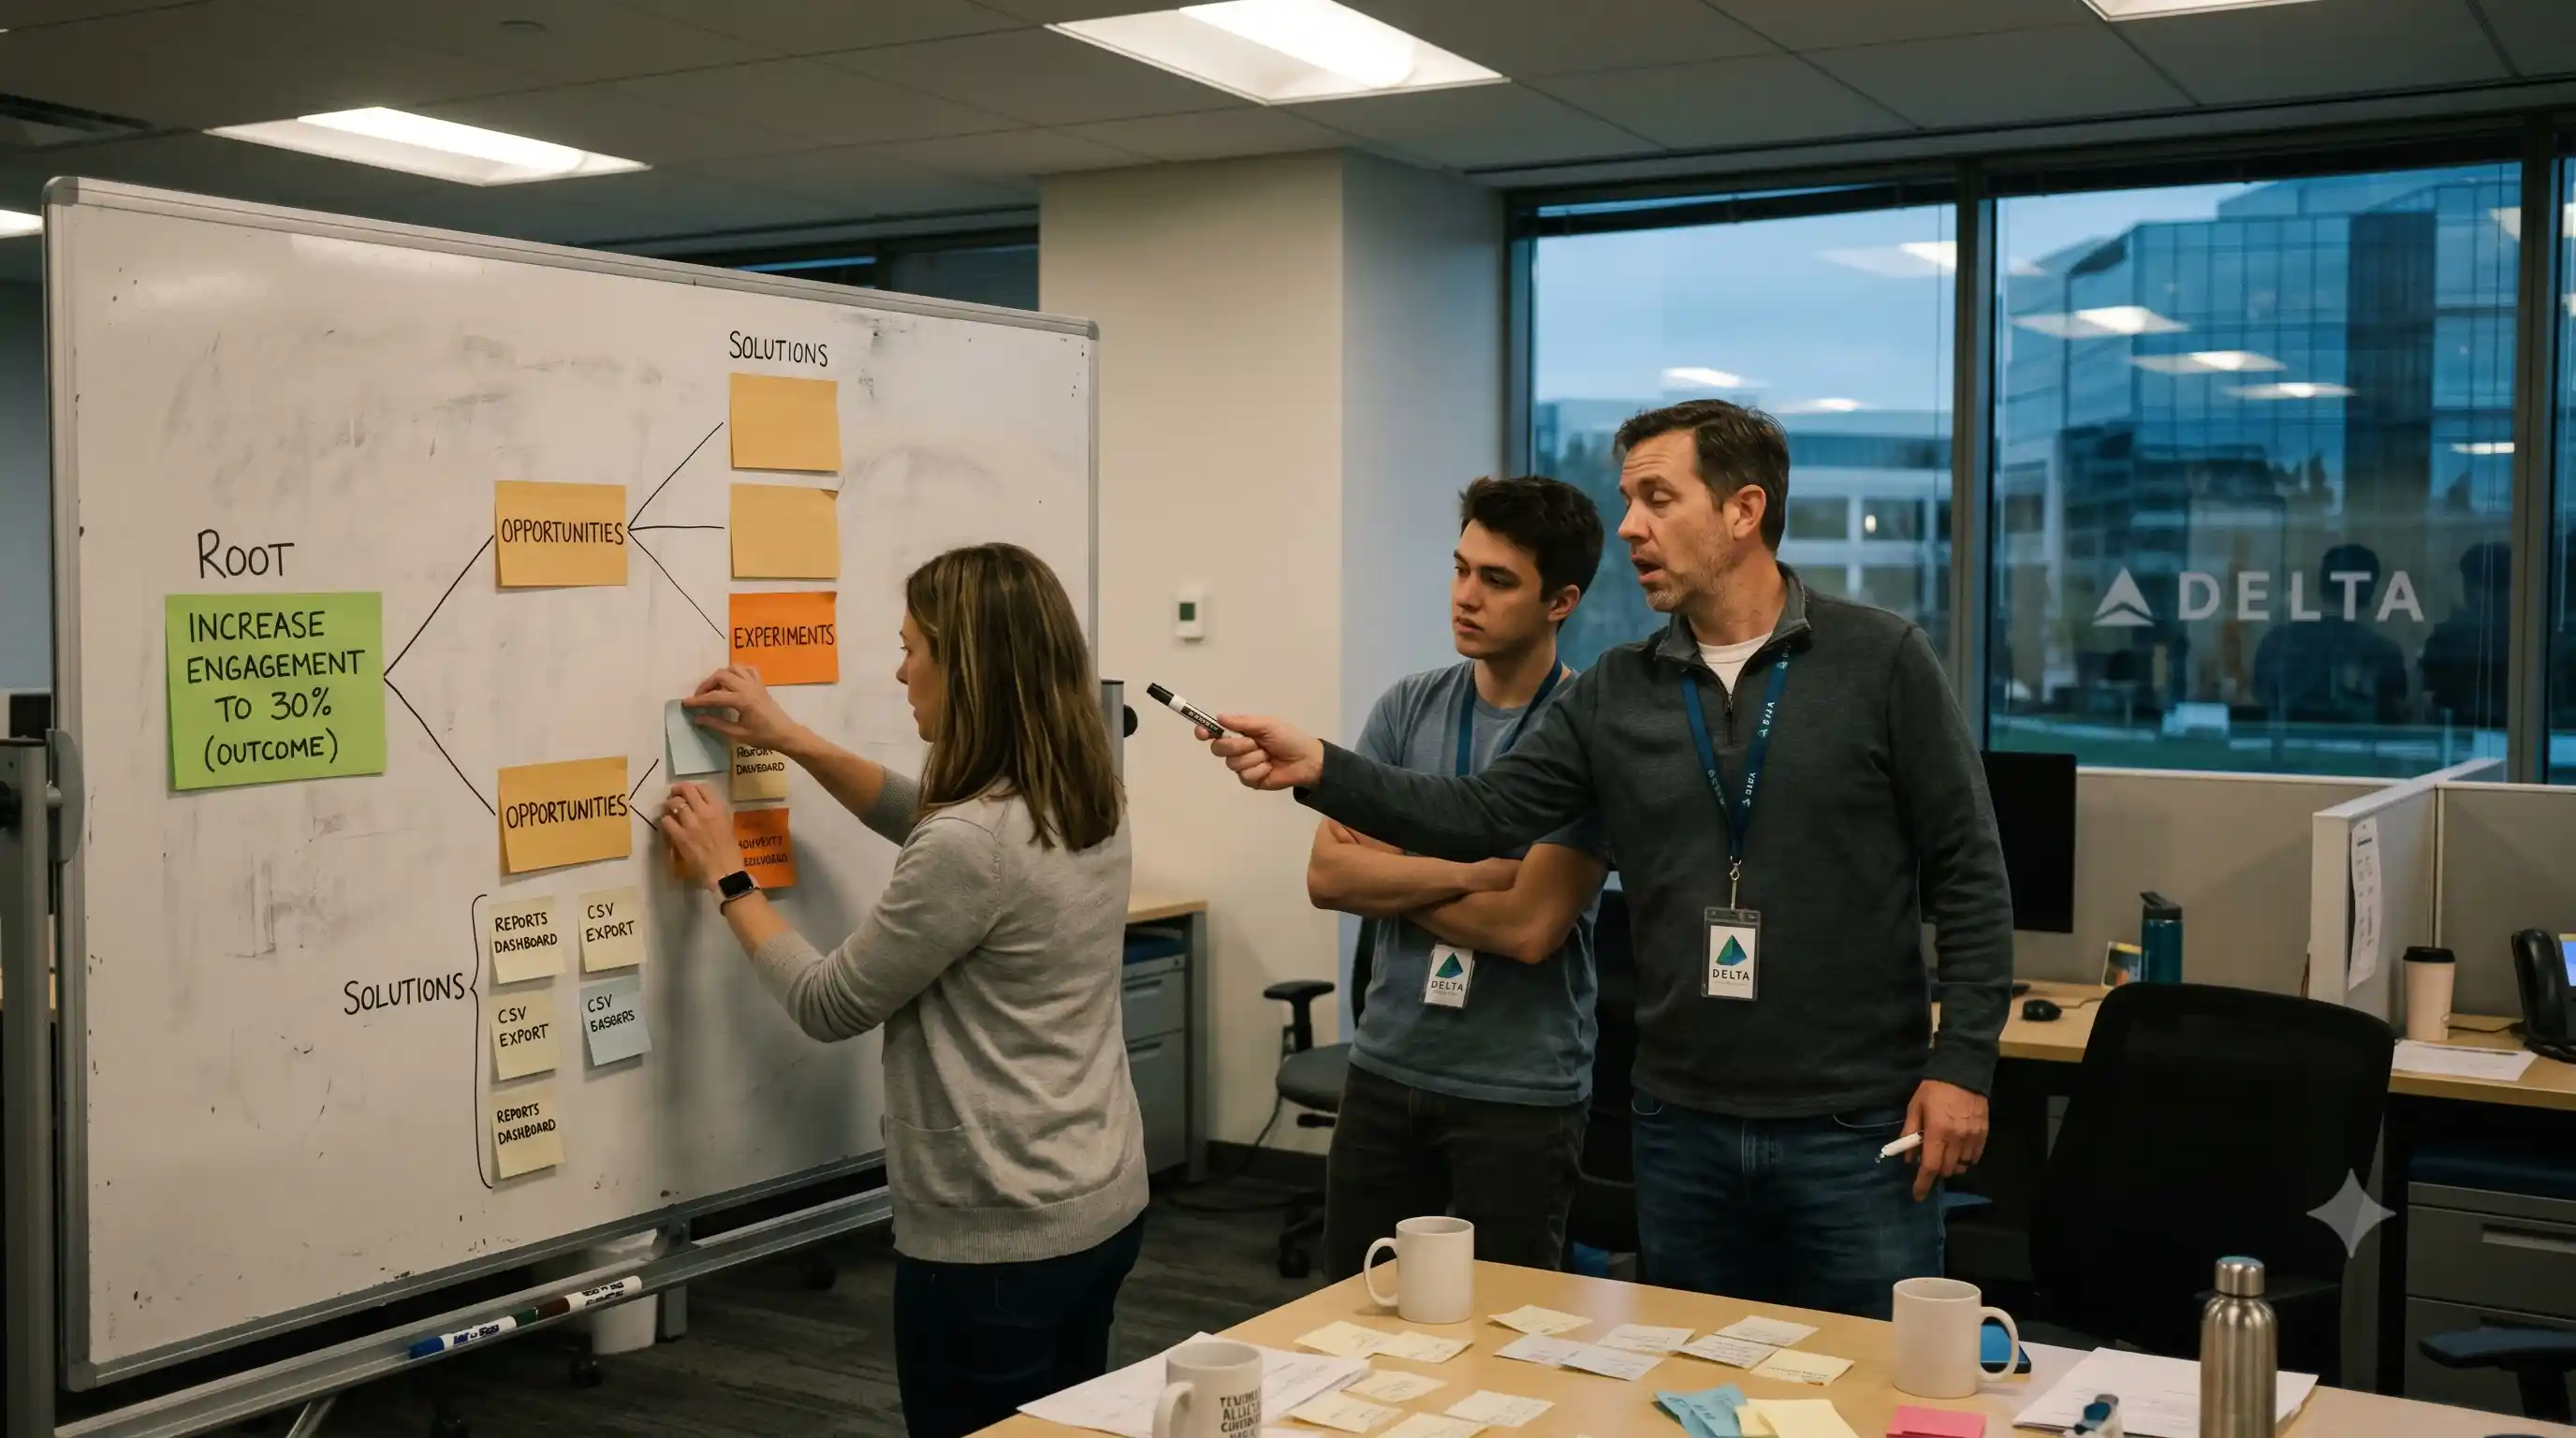
Bad Outcome: Launch the new reporting dashboard by Q3. Good Outcome: Increase weekly active dashboard users from 15% to 30%.
If your root is flawed, every branch that grows beneath it will be misaligned.
The Branches: Mapping Customer Opportunities
Directly beneath the outcome sit the opportunities. These are the specific customer needs, pain points, or desires extracted directly from continuous user interviews.
Do not write solutions here. "Build a CSV export tool" is a solution. "I need an easier way to share data with my CFO" is an opportunity.
Mapping out a wide array of opportunities allows you to target the customer problems that offer the highest potential leverage for your business metric.
The Leaves: Generating Solutions and Experiments
Once an opportunity is selected, you branch out into multiple potential solutions. You must map competing ideas side-by-side to avoid falling in love with your first concept.
Below each solution, you map rapid, tactical validation experiments. These are the fast, low-fidelity tests that generate the data required to prove your ideas work.
By establishing clear test parameters for each leaf on your tree, you embed true hypothesis driven development into your team's daily operating DNA.
How to Avoid "Decoration" Syndrome
A common failure mode occurs when teams build a beautiful diagram in Miro during a quarterly planning session, only to never look at it again.
An unmaintained tree is worse than no tree at all. It provides a dangerous illusion of strategic alignment.
Forcing Strict Evidence-Based Pruning
To prevent your tree from becoming corporate decoration, you must actively prune it. When an experiment fails, mark it in red. If an entire solution branch proves unviable, cross it out.
Do not delete failed branches. Leaving the failures on the board creates a permanent, visible record of your team's validated learning, preventing future executives from forcing you to repeat the exact same mistakes.
Integrating the Tree into Your Discovery Cadence
The most successful teams review their opportunity maps weekly. As you conduct fresh customer interviews, you will discover new opportunities to map and new solutions to debate.
This rhythm acts as the heartbeat of a high-functioning product trio, a concept we explore deeply in our guide on continuous discovery.
When your visual framework and your weekly interview cadence sync perfectly, your discovery process transforms from a chaotic brainstorming session into a predictable engine for business growth.
Conclusion & CTA
If your team is struggling to connect their daily engineering tasks to high-level strategic goals, your discovery process lacks structure.
Stop managing feature backlogs and start managing your product risk. Build your first opportunity solution tree today.
Define your outcome, map your customer pain points, and force your team to validate their favorite solutions against hard market data before writing another line of code.

Frequently Asked Questions (FAQ)
A visual framework that maps a clear business outcome to customer opportunities, potential solutions, and validation experiments. It prevents teams from building random features by forcing strict, logical alignment between what customers need and what the business aims to achieve.
The framework was created and popularized by Teresa Torres, a prominent product discovery coach. She developed the model to help product teams adopt continuous discovery habits and transition their roadmaps from rigid feature lists to flexible, outcome-driven strategies.
Start at the top by defining a single, measurable business outcome. Branch downwards to list customer pain points (opportunities) uncovered in interviews. Below those, branch out into potential feature ideas (solutions), and finally, list the rapid tests (experiments) to validate them.
An opportunity is a verified customer need, desire, or friction point—it describes a problem that exists in the market. A solution is the specific software feature, product, or service your team designs to address that underlying problem.
It creates a direct visual linkage. Every experiment tests a solution, every solution addresses an opportunity, and every opportunity is selected specifically because solving it has the highest mathematical probability of driving the overarching business outcome at the root.
Experiments form the bottom-most layer of the tree. They act as the tactical validation filter for your solutions. Instead of building the whole solution, you design small, low-fidelity experiments to test the riskiest assumptions supporting that specific branch.
A traditional roadmap is a timeline that commits a team to delivering specific software outputs by specific dates. An opportunity solution tree is a discovery tool that explores multiple paths to achieve a goal, adapting dynamically as new market evidence emerges.
You can build effective trees using standard digital whiteboard tools like Miro, Mural, FigJam, or Lucidchart. The specific software matters far less than the team's commitment to keeping the visualization updated based on weekly customer interview data.
You should update the tree continuously, ideally every week. Every time your product trio completes a customer interview or finishes a validation experiment, you must adjust the branches, prune failed solutions, and add newly discovered market opportunities.
Common errors include writing features instead of problems in the opportunity tier, testing only one solution per opportunity, failing to update the map after experiments conclude, and tracking vanity outputs at the root instead of hard business outcomes.